EARTHQUAKES
& Other Natural Phenomena
Quake Log
In a study published in “Nature,” USGS seismologist Fred Pollitz and colleagues analyzed the unprecedented increase in global seismic activity triggered by the Magnitude-8.6 East Indian Ocean quake of April 11, 2012, and in a recently published study in the “Proceedings of the National Academy of Sciences,” seismologist Volkan Sevilgen and his USGS colleagues investigated the near-cessation of seismic activity up to 250 miles away caused by the 2004 M9.2 Sumatra earthquake.
While aftershocks have traditionally been defined as those smaller earthquakes that happen after and nearby the main fault rupture, scientists now recognize that this definition is wrong. Instead, aftershocks are simply earthquakes of any size and location that would not have taken place had the main shock not struck. http://earthsky.org/science-wire/rare-great-earthquake-triggers-large-aftershocks-all-over-the-globe
While aftershocks have traditionally been defined as those smaller earthquakes that happen after and nearby the main fault rupture, scientists now recognize that this definition is wrong. Instead, aftershocks are simply earthquakes of any size and location that would not have taken place had the main shock not struck. http://earthsky.org/science-wire/rare-great-earthquake-triggers-large-aftershocks-all-over-the-globe
Keep in mind that the statistical average for Class 6+ quakes is one every two days.....somewhere in the world, most probably in the Ring of Fire. But they tend to group around the Lunar Full and New phases. It is a virtual certainty to have a Class 6+ quake every syzygy or within a day.
It is generally true that you will get two or three within a three day syzygy window.
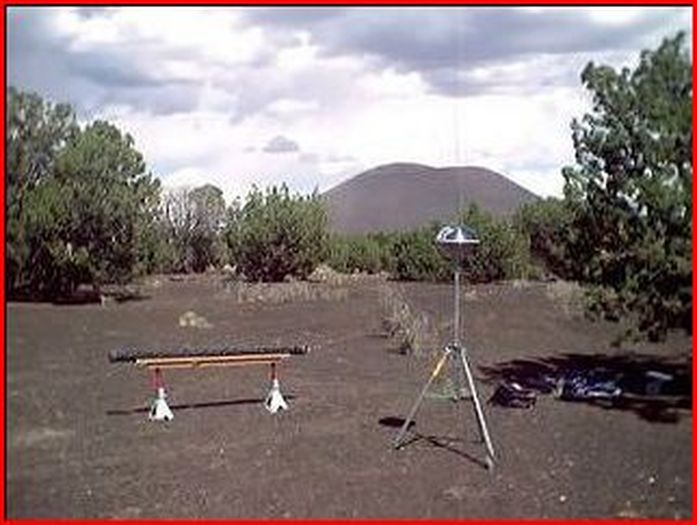
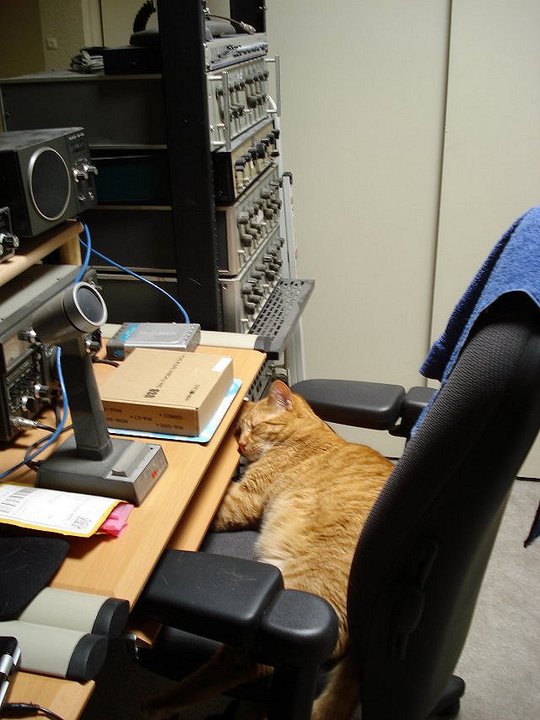
What kind of equipment do you need to do what I do? Some of it is behind me over my left shoulder in this poor photo. The rest is outside built into the housing of the sensing coil. Most of what it sees is traveling through the earth or perhaps just above it.
2014 Quake Log
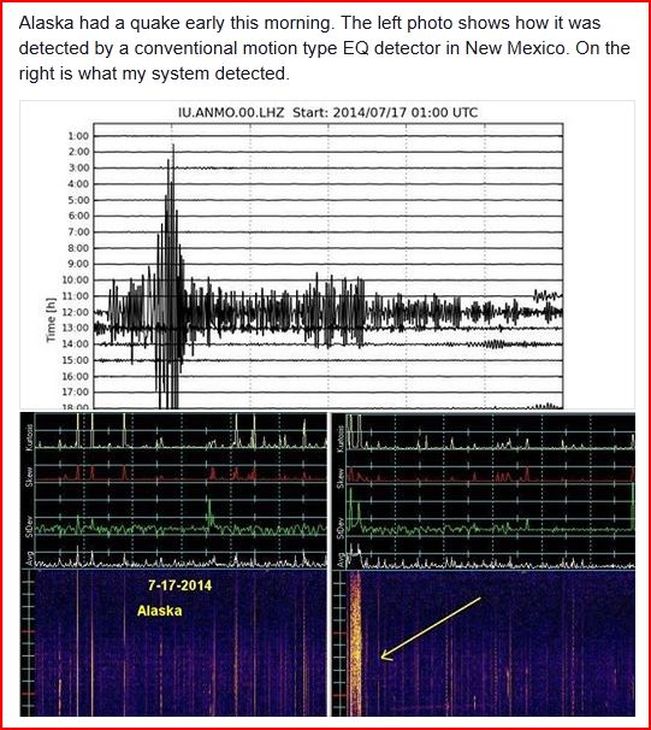
July 17, 2014 - ALASKA :
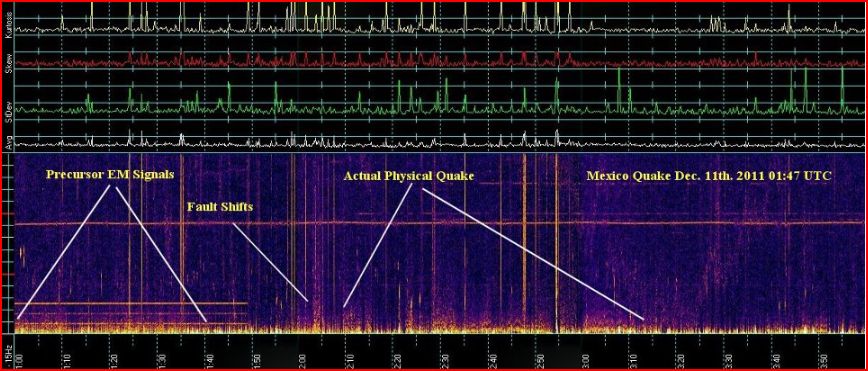
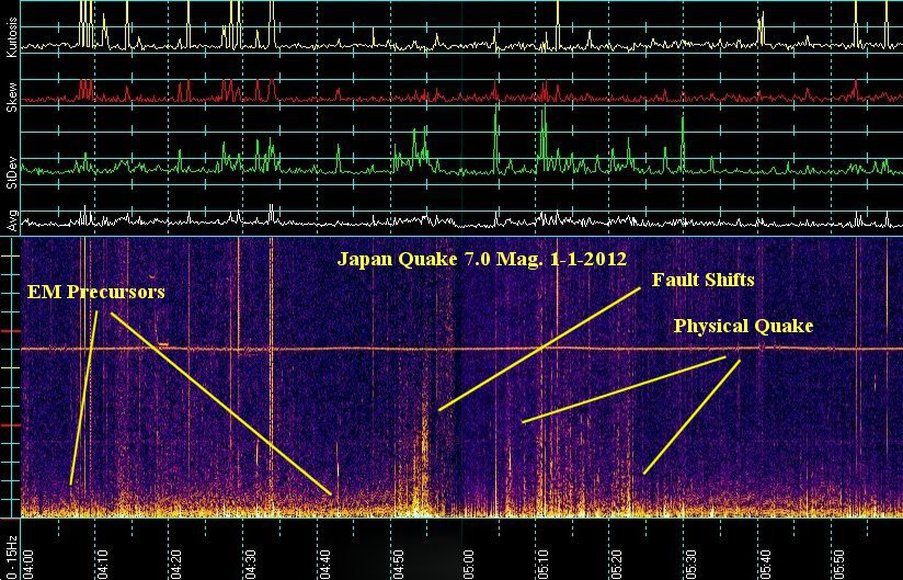
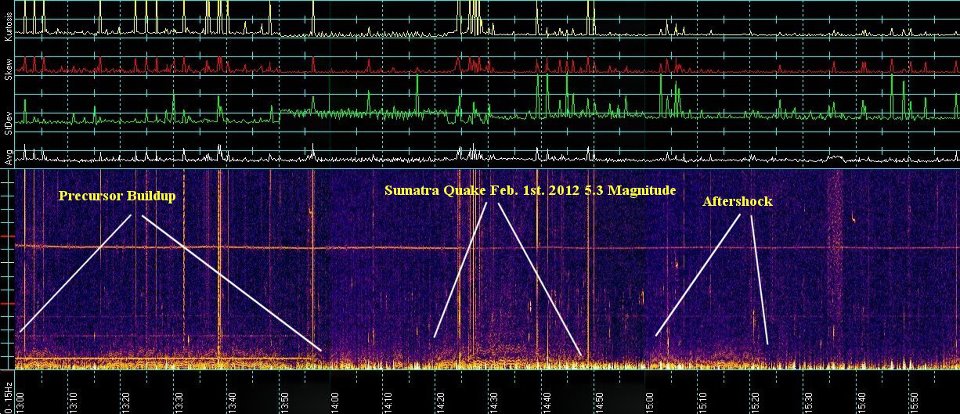
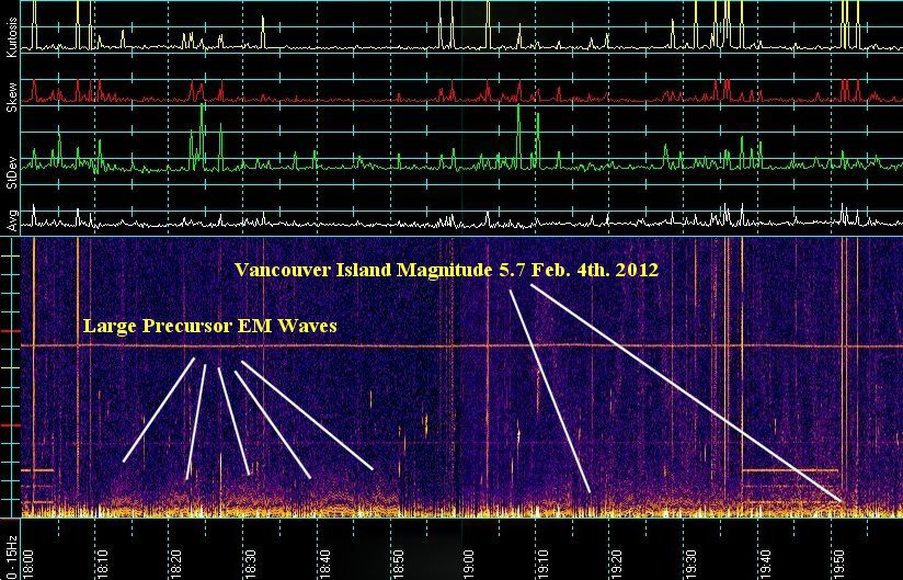
So, my system detected the electromagnetic signature of the quake before it was mechanically detected. Sometimes I can detect the electromagnetic signature of a quake waiting to happen hours or days before it does.
So, my system detected the electromagnetic signature of the quake before it was mechanically detected. Sometimes I can detect the electromagnetic signature of a quake waiting to happen hours or days before it does.
2013
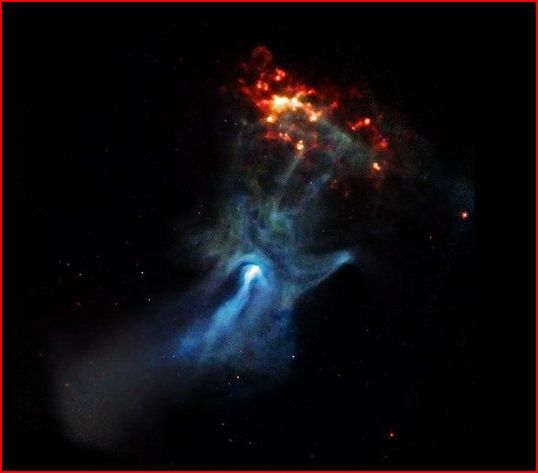
The Hand of God Moves
2011 Quake Log
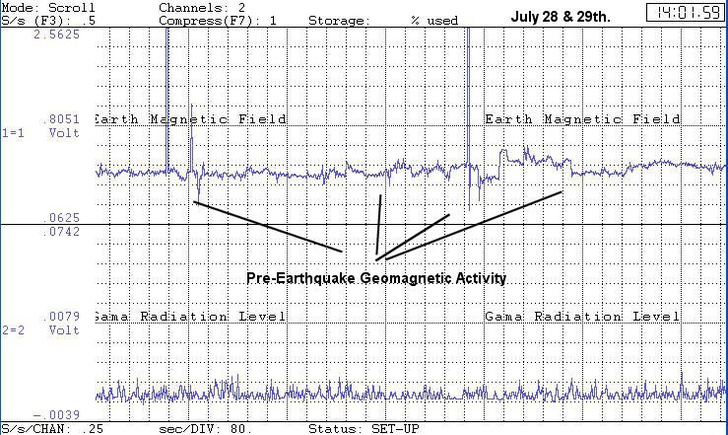
July 28-29, 2011. Mother is getting restless Geomagnetically speaking out in the west.
This is beneath the planets surface magnetics I speak of. It was just a matter of time after Japan
when this side of the plate acted up.
This is beneath the planets surface magnetics I speak of. It was just a matter of time after Japan
when this side of the plate acted up.
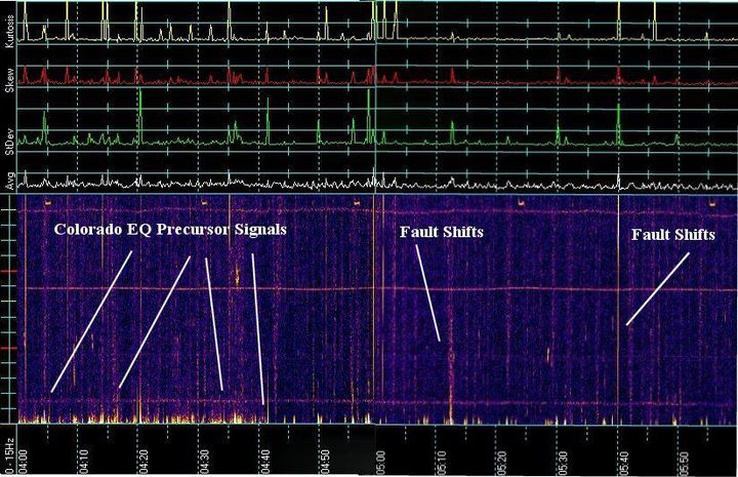
9/23/11 Colorado Quake electromagnetically detected before it mechanically manifested.
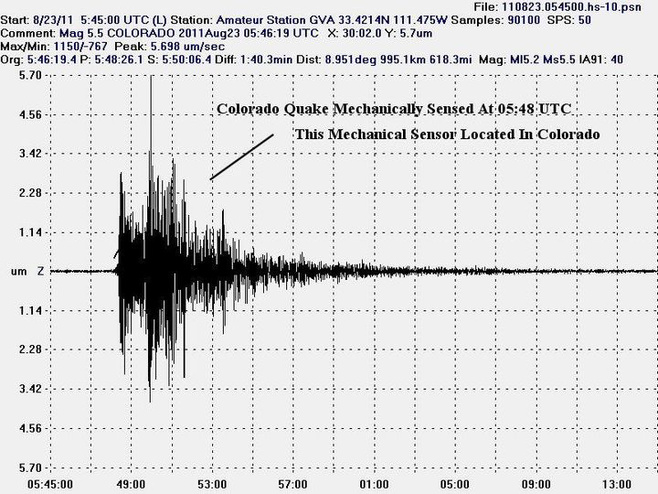
August 2011 Colorado Quake mechanical detection
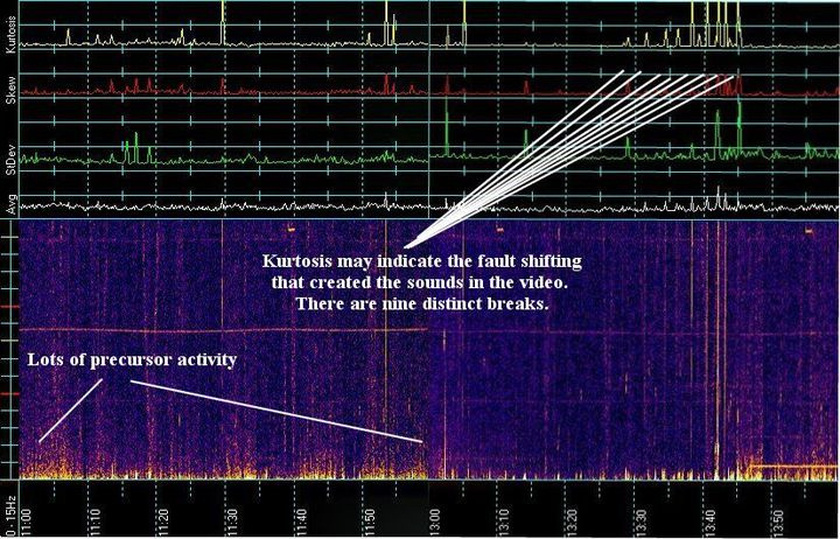
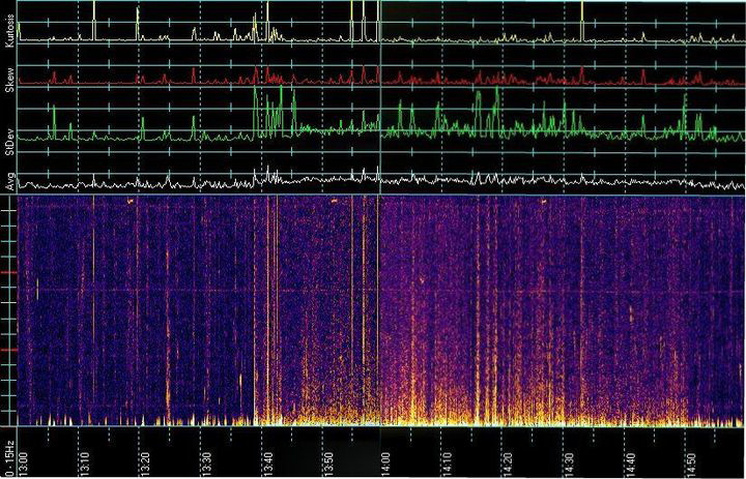
I went back through my collected data for the 22nd. which is when the Colorado video was made by the hikers. If you saw it you could hear what sounded like rocks snapping deep in the ground. If you look at the nine spikes in Kurtosis in this chart they might be the electrical signature of the fault cracking which makes the sound in the video. As said tis a long shot but we are in uncharted territory. I tried sending a message to the guys who took the video but they only allow friends. I wanted to ask what time on the 22nd.
Washington DC Quake, August 23, 2011
Again my system detected the Electromagnetic signals generated by the Virginia fault before it was mechnically detected. There is a big difference in coil design. Gakona is 3 feet in length whereas my Frankencoil is six feet with a high permeability core (over 2,000,000) and has 7.5 miles of wire wound on it. Just plain ultra sensitive. if a clone of my station was located one in every state. You could triangulate a signal source and have a fair amount of warning time to get out of buildings.
Again my system detected the Electromagnetic signals generated by the Virginia fault before it was mechnically detected. There is a big difference in coil design. Gakona is 3 feet in length whereas my Frankencoil is six feet with a high permeability core (over 2,000,000) and has 7.5 miles of wire wound on it. Just plain ultra sensitive. if a clone of my station was located one in every state. You could triangulate a signal source and have a fair amount of warning time to get out of buildings.
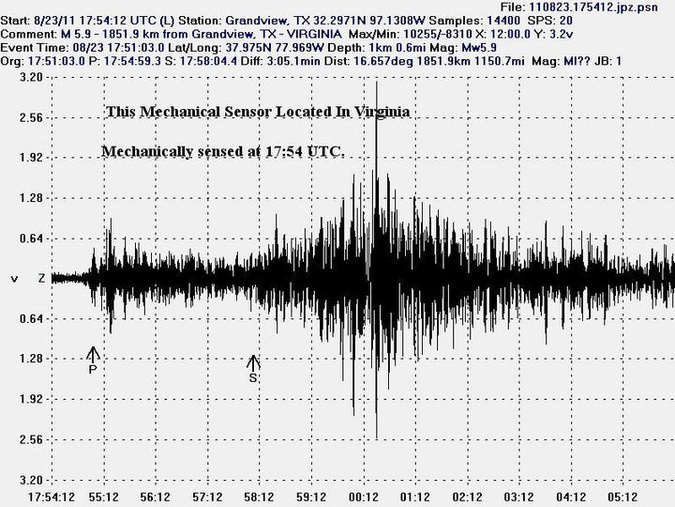
Here is the mechanical sensor chart located in Virginia. I could have given them a 34 minute warning.
Longer if my sensor would have been located there and not out here
Longer if my sensor would have been located there and not out here
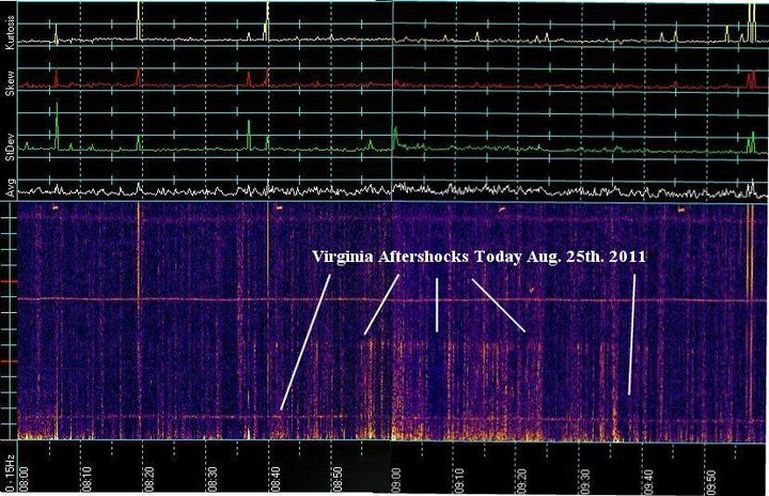
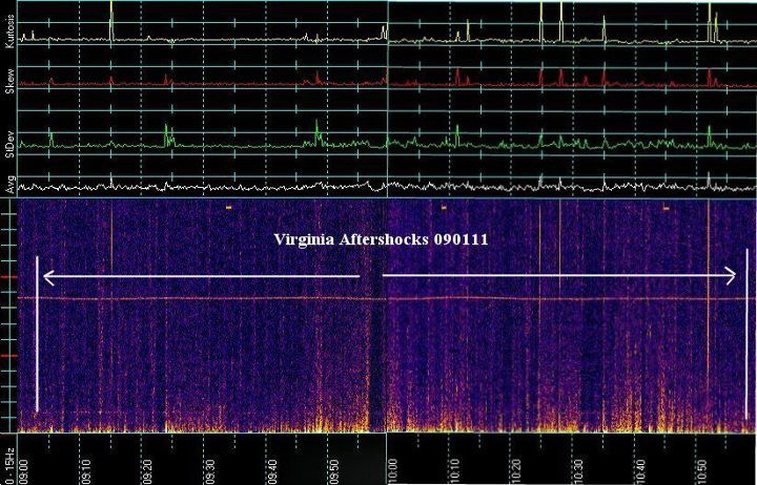
Viirginia Aftershocks
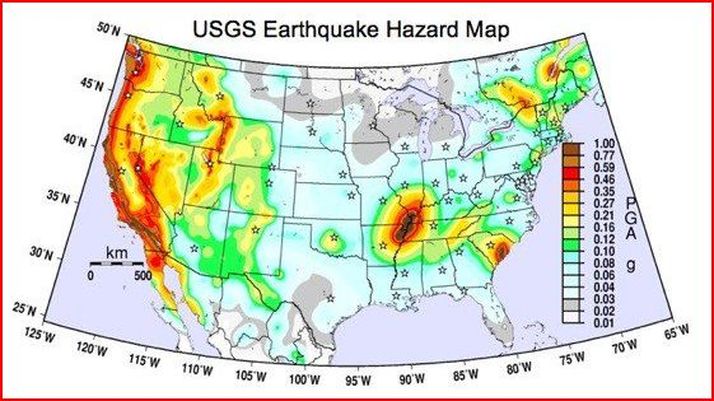
I am concerned about areas in Red. Especially The New Madrid Fault. But I still think California is in for it first.
California Quake 8/24/11 - California. Small at 3.4 Magnetude. This is the electromagnetic signature
given off by the fault before the mechanical was detected.
System detected the electrical signature of this California quake almost 3.5 hours before it happened physically.
given off by the fault before the mechanical was detected.
System detected the electrical signature of this California quake almost 3.5 hours before it happened physically.
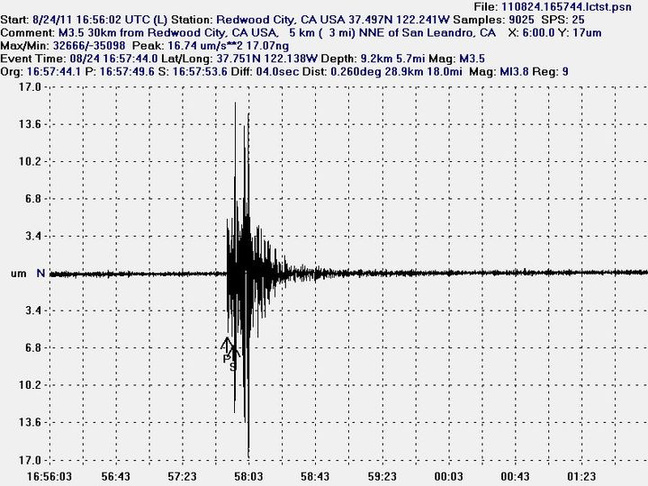
This is the mechanical detection of the California quake.
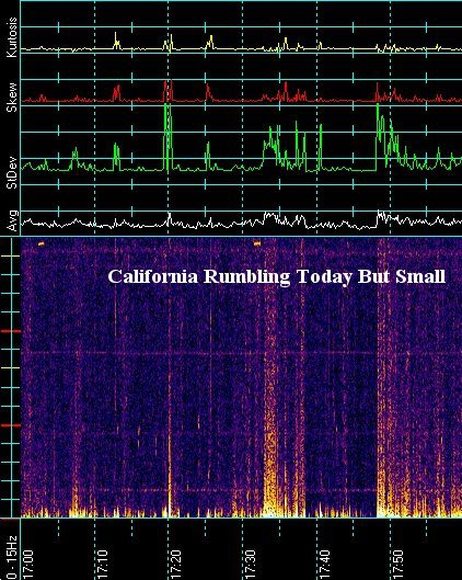
California Rumbling
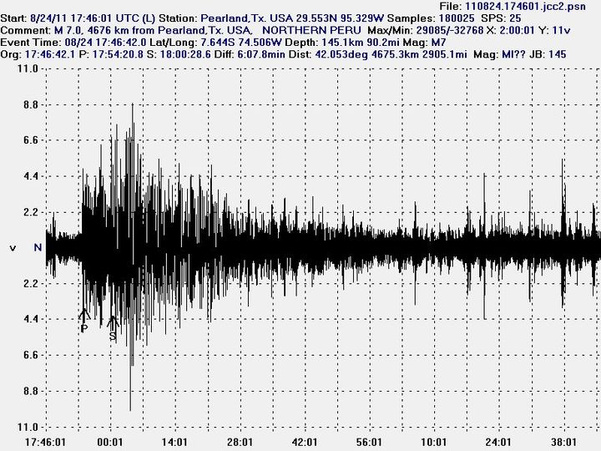
Here is the electromagnetic signature of the Peruvian quake before it was felt. I have not heard but hope no one was hurt. My system detected the electrical signature of this Peruvian quake today only 20 minutes before it hit vibrationally. So much depends on the rock strata the electromagnetic signature must travel as well as soil content.
You can see my system is a little bit of an early warning system.
You can see my system is a little bit of an early warning system.
Here is the mechanical detection of the Peruvian quake.
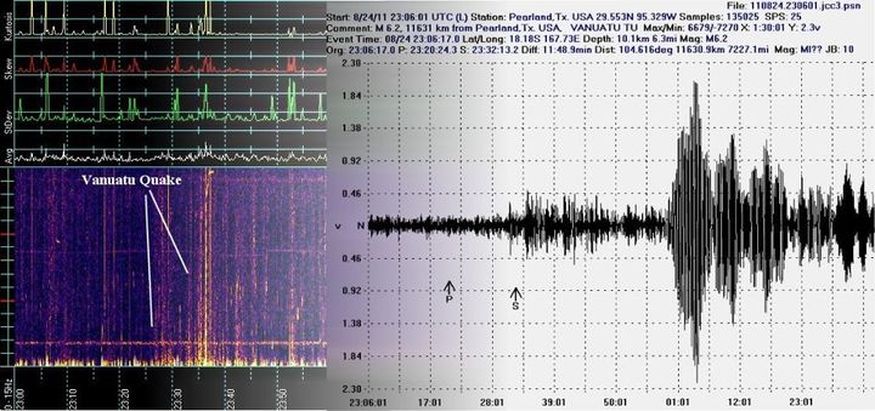
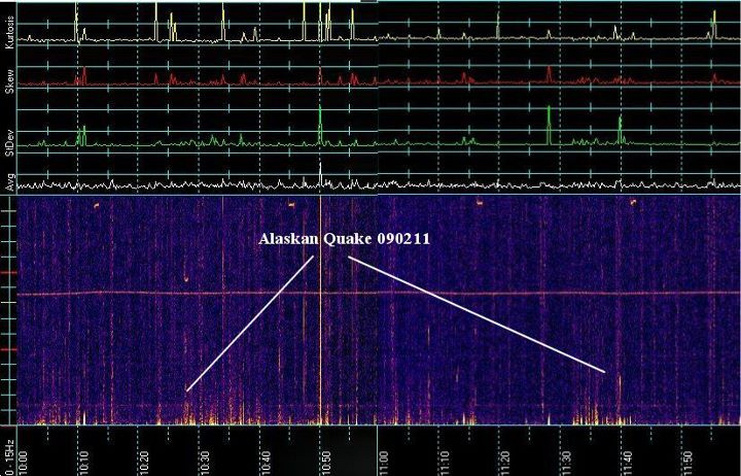
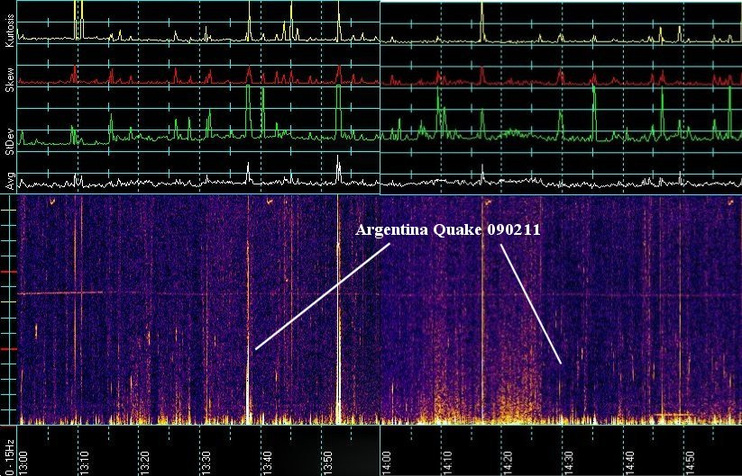
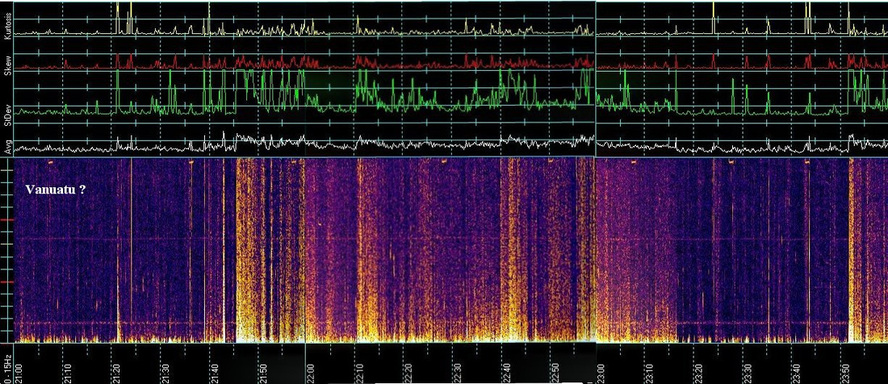
Vanuatu Quake - 082411. Pretty weak signature but it is 12,000 miles away.
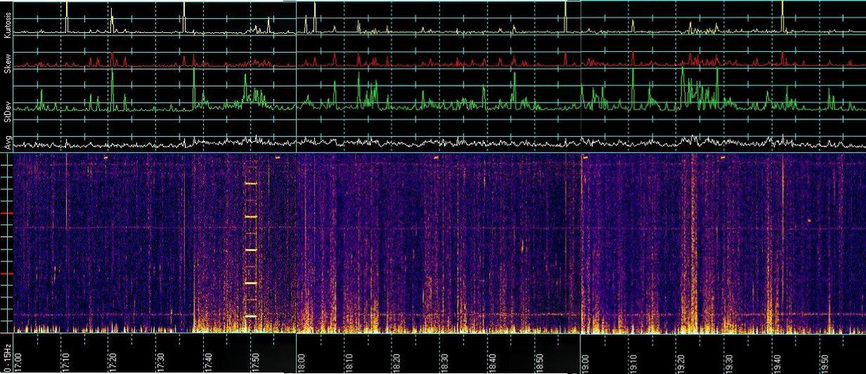
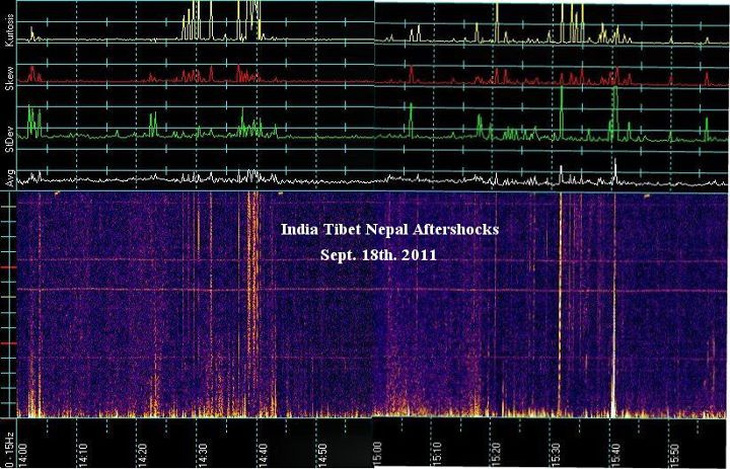
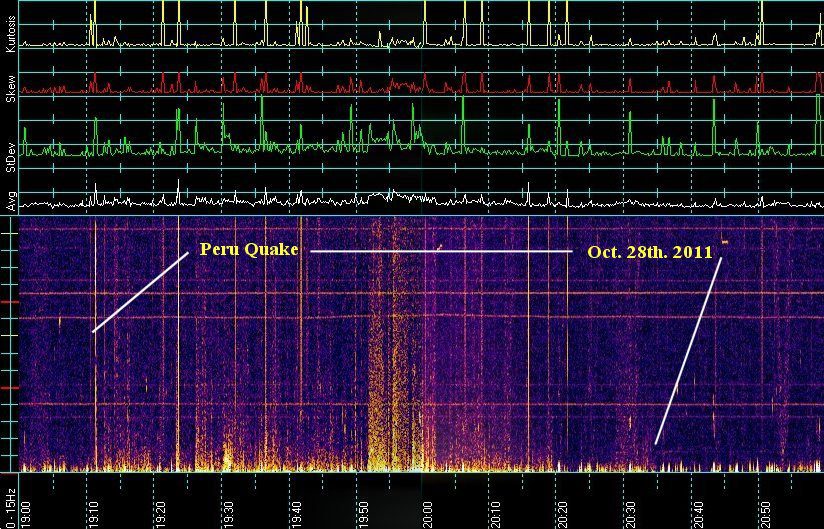
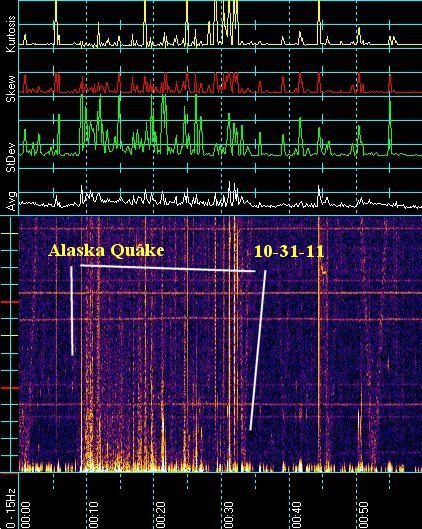
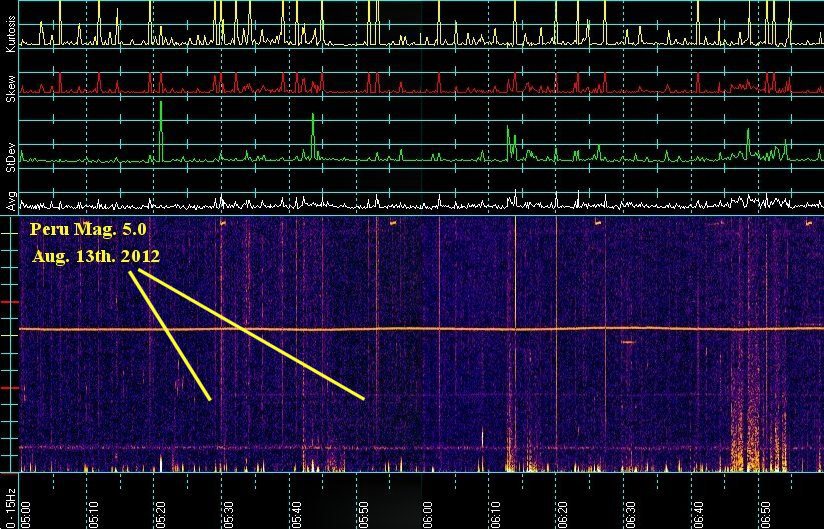
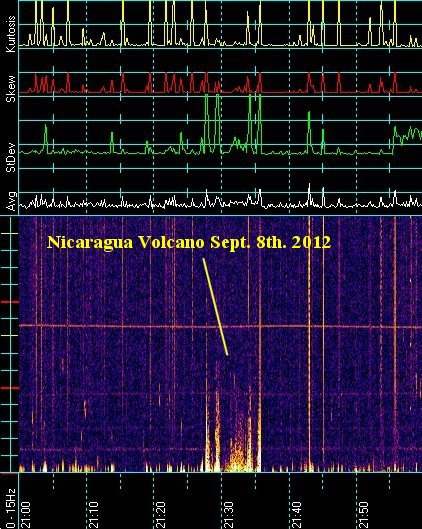
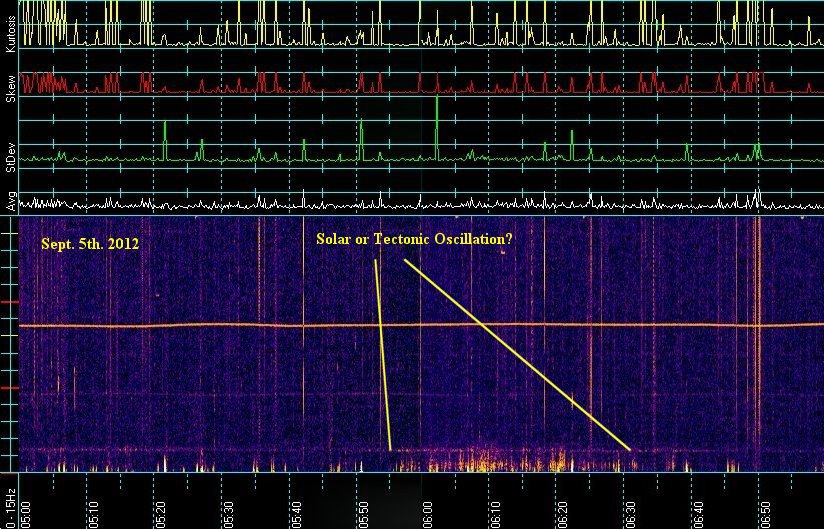
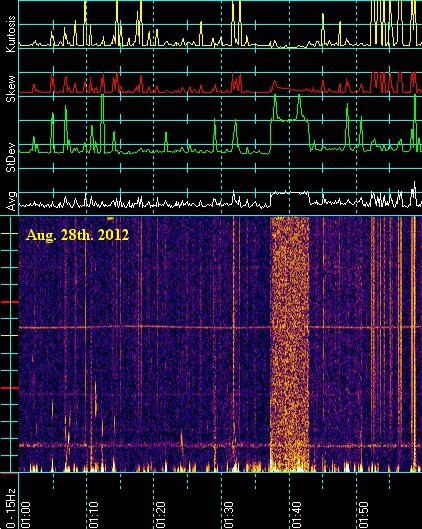
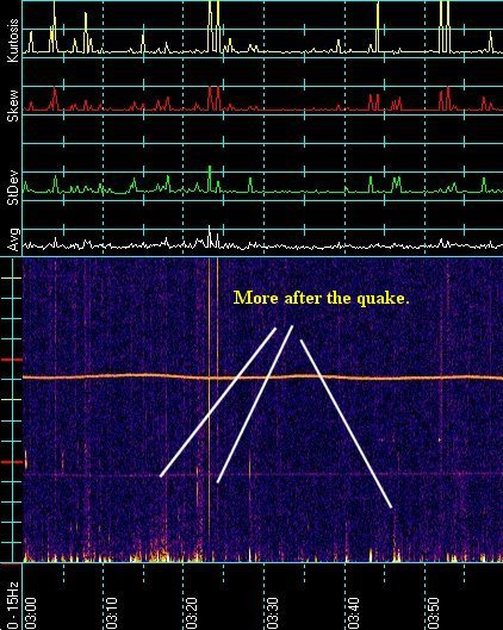
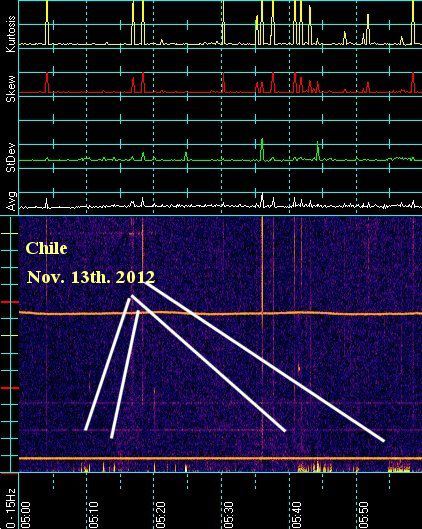
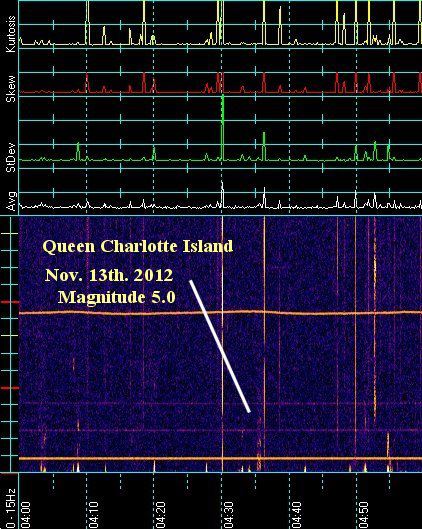
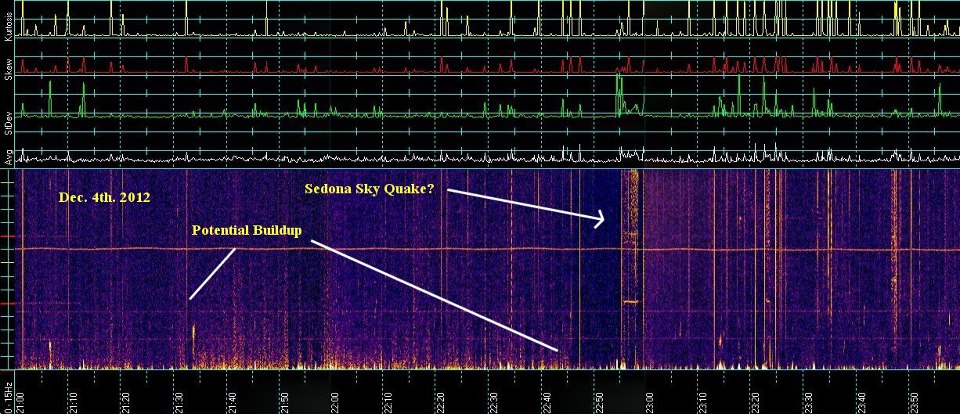
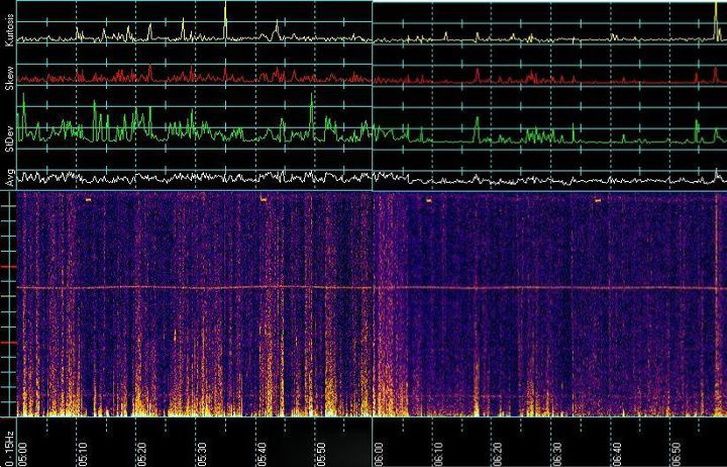
All the chart is doing is verifying there are aftershocks. The ticks on the left side of the chart represent frequency. Each tock 1Hz.
The bottom of course is time. The brighter yellowish coloration represents electromagnetic activity at any given time and frequency.
The bottom of course is time. The brighter yellowish coloration represents electromagnetic activity at any given time and frequency.
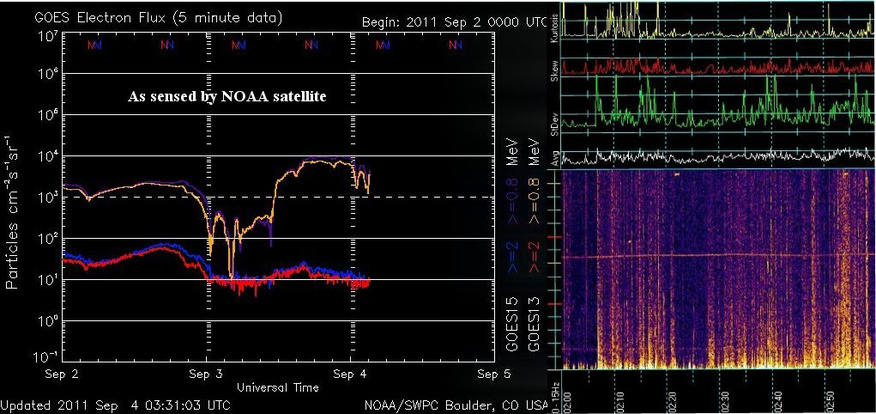
9/3/11 Not Vanuatu - electron flux, solar
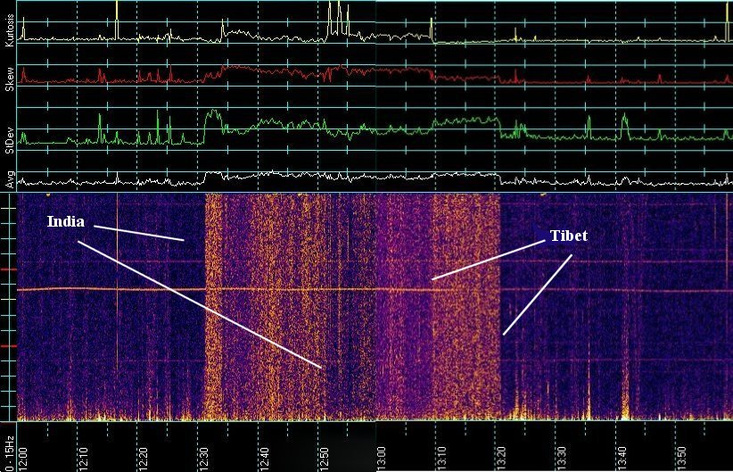
THIS WAS TWO QUAKES! Sept. 18th. 2011
This chart just might prove a theory. Years ago as ham operator I would attempt communication long haul via what is called grayline propagation. The grayline is the line formed around the planet at the sunset/sunrise transition. Just look at the globe and follow the line around the planet when that line is twilight somewhere on the planet. It is a narrow time period where ionization in the atmosphere is just right to act as a conduit along that line for radio waves. I used it once to communicate with India and Mongolia at low frequencies. Works great depending on ionization. Now for years it has always been wondered if ultra low frequencies could propagate via grayline. When the quake hit India and the other countries they were in the grayline near their sunset. We were in grayline sunrise. I hypothesize the Pholes (Positively charged) particles that were given off into the atmosphere there gave off a broadband signal when they reacted with the negatively charged ions in the atmosphere. THAT may be why the signal in the chart is equal strength from DC all the way beyond 15Hz. which is the limit of the software. We may be seeing atmospheric reaction to positively charged particles being eaten by ionized negative ions. THAT reaction propagated via grayline to the equipment here. If this is true it has never been proven until now. Usually my charts show stronger signals below 3Hz. as that signal travel through the earth. We may have made history but no one will believe it.
Benjamin wrote: "This chart really is different from others in that usually the electromagnetic signals that travel from a quake to my equipment are strongest below 3Hz. In this chart everything is equal strength all the way up to 15Hz. and beyond. The quakes originated half way around the planet so my guess would be the Em wave traveled close to the core of the planet to get here rather then beneath the crust and around. No one else is doing this so I have nothing to compare it to."
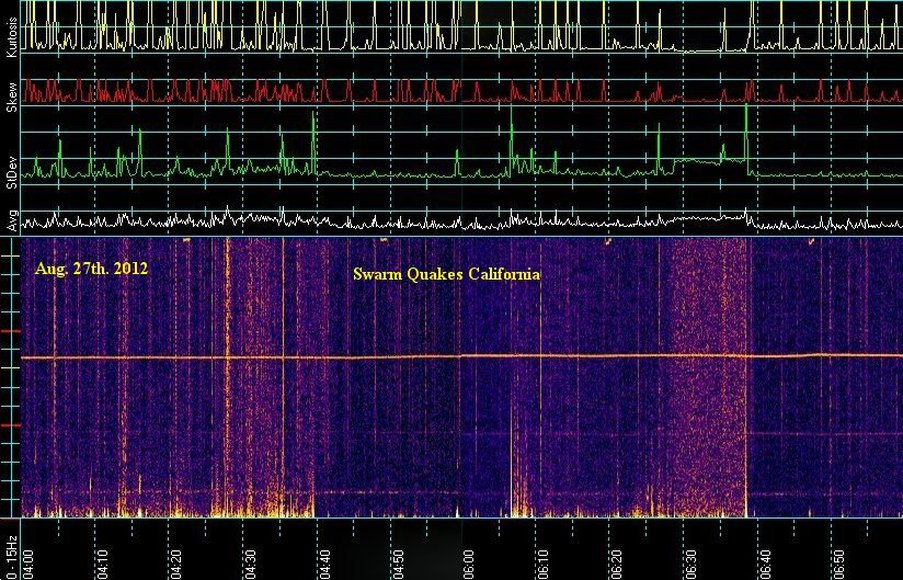
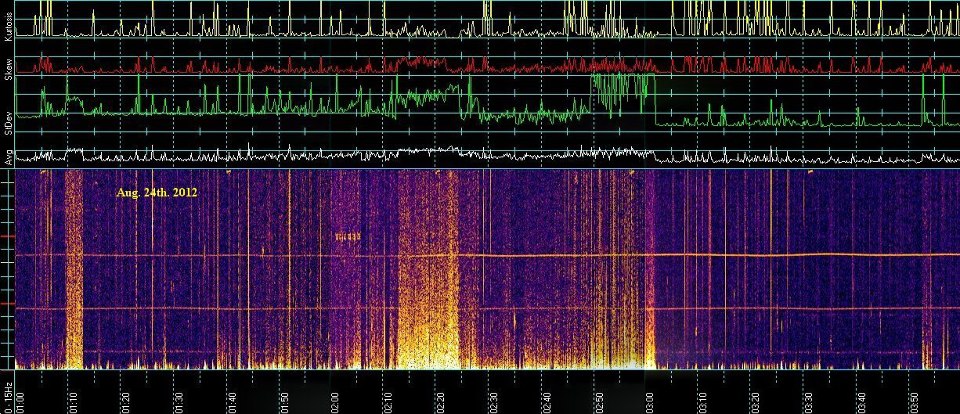
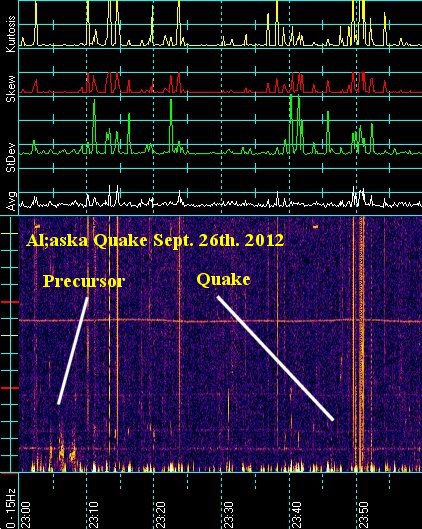
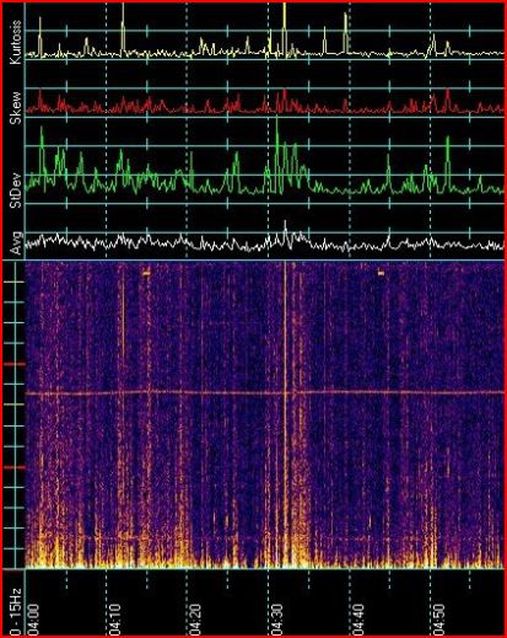
Do a Wikipedia search on Kurtosis which is the yellow lines at the top of these charts. What they mean will tell you why they are important. In probability theory and statistics, kurtosis (from the Greek word κυρτός, kyrtos or kurtos, meaning bulging) is a measure of the "peakedness" of the probability distribution of a real-valued random variable, although some sources are insistent that heavy tails, and not peakedness, is what is really being measured by kurtosis.[1] Higher kurtosis means more of the variance is the result of infrequent extreme deviations, as opposed to frequent modestly sized deviations. http://en.wikipedia.org/wiki/Kurtosis
Magnitude 6.9 Quake Peru Oct. 28th. 2011 as recorded in Arizona.
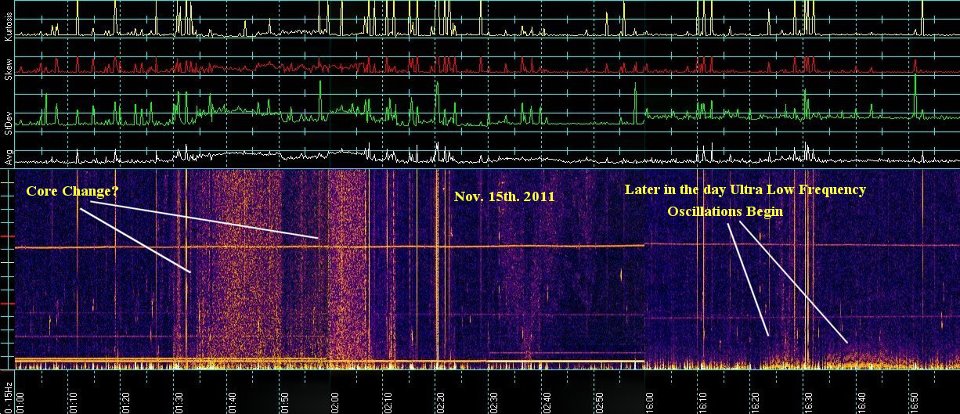
CORE CHANGE? Based on mention of a disturbance from the earth's core back on Nov. 15th. 2011.,
Ben went back through all the charts from that day and came up with this, above.
Ben went back through all the charts from that day and came up with this, above.
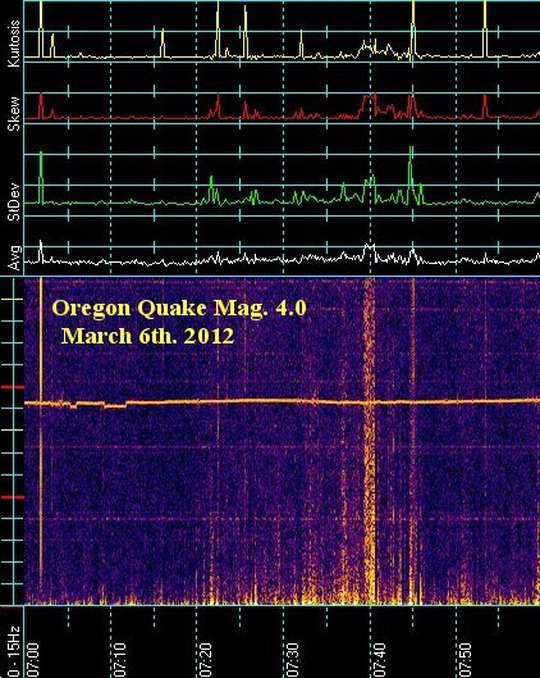
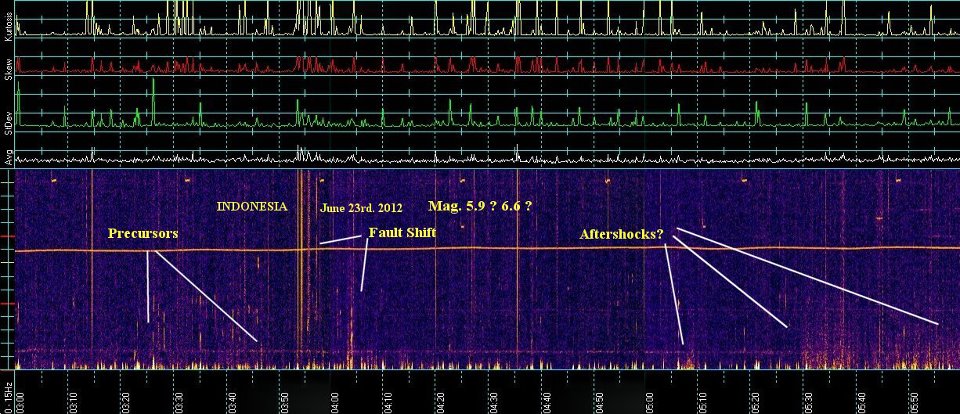
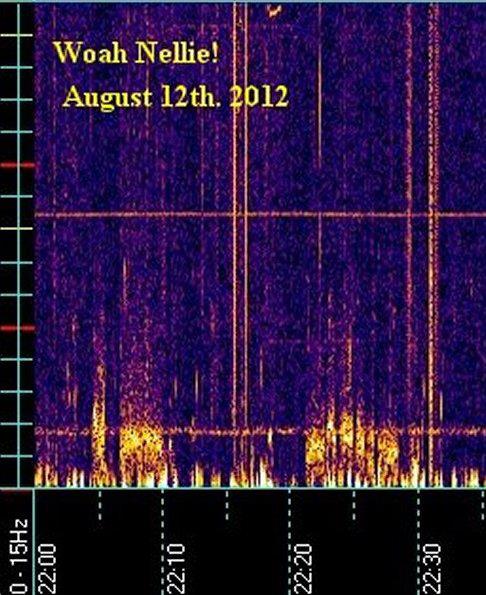
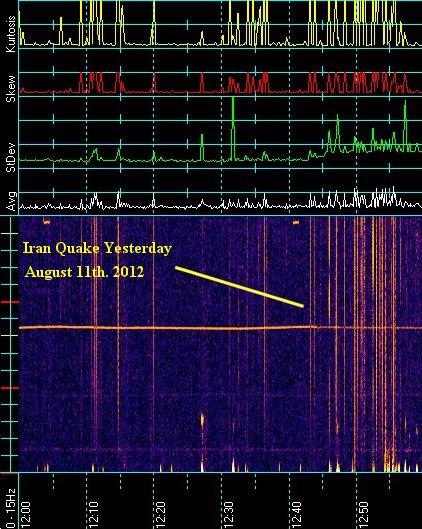
2012 Quake Log
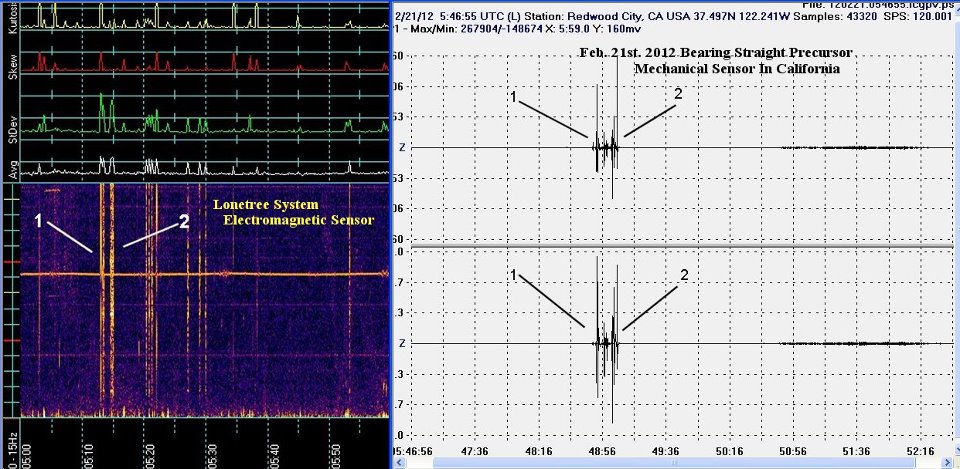
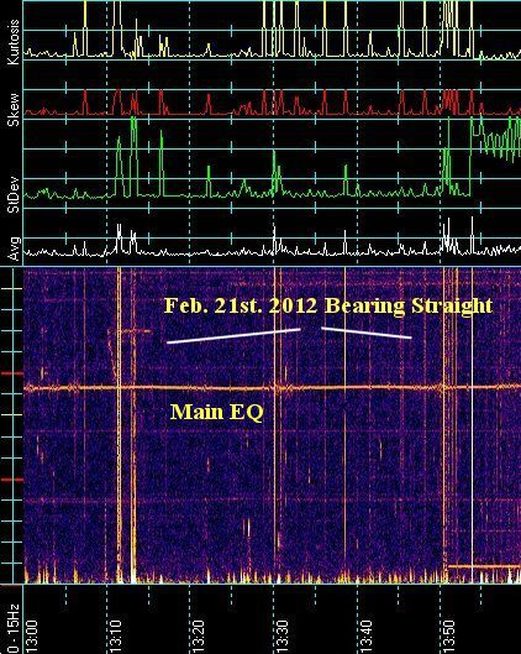
Above 2/21 precursors
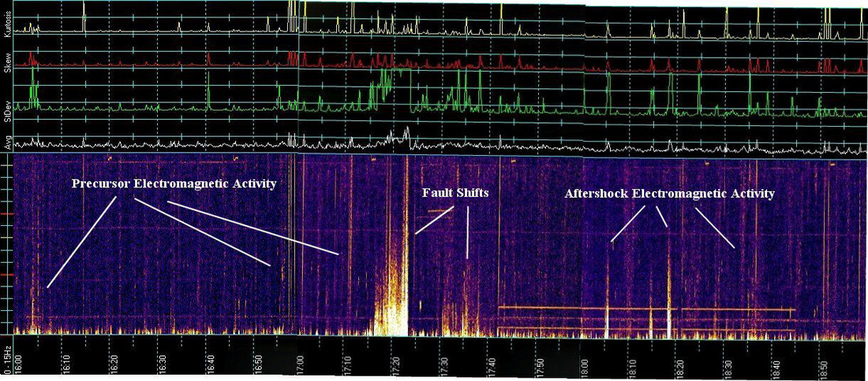
A strange day as my equipment saw activity 8 hours before the actual quake and a mechanical sensing system in CA also saw it but 20 minutes after mine. Lots going on today with the Earth in America.February 21 at 11:24pm · Perhaps both of our sensors saw something small happening beneath CA rather then the Bearing Straight. Tis a hard one one to call. The back to back (double) fault shifts are unique.
A strange day as my equipment saw activity 8 hours before the actual quake and a mechanical sensing system in CA also saw it but 20 minutes after mine. Lots going on today with the Earth in America.February 21 at 11:24pm · Perhaps both of our sensors saw something small happening beneath CA rather then the Bearing Straight. Tis a hard one one to call. The back to back (double) fault shifts are unique.
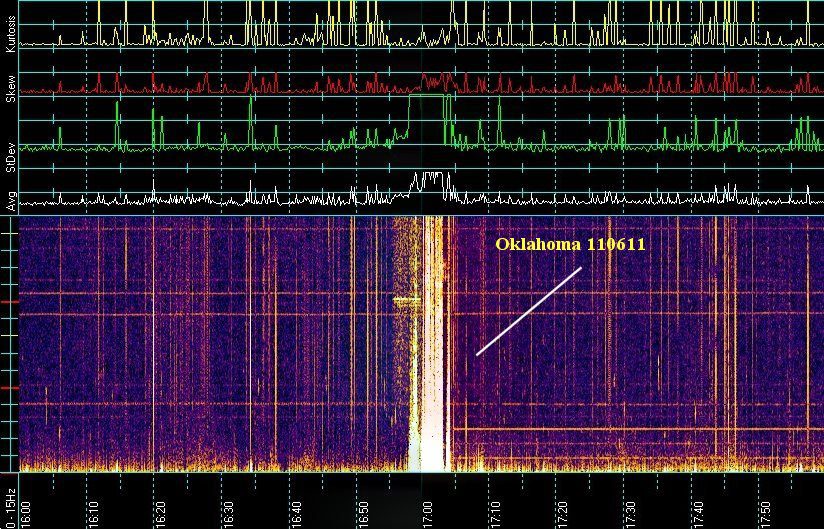
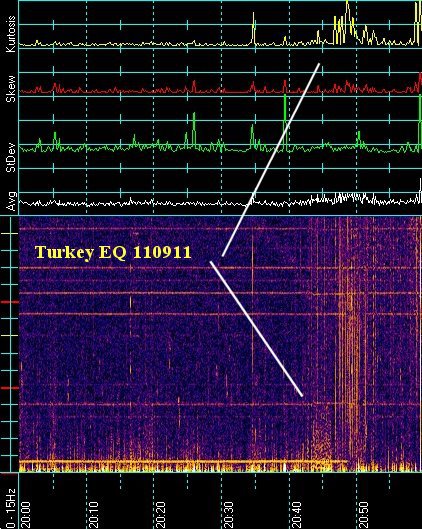
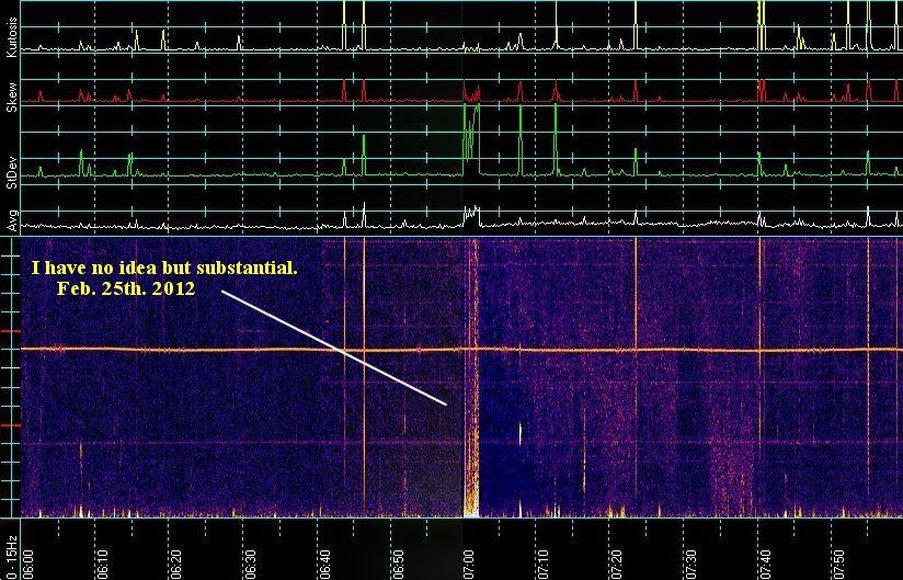
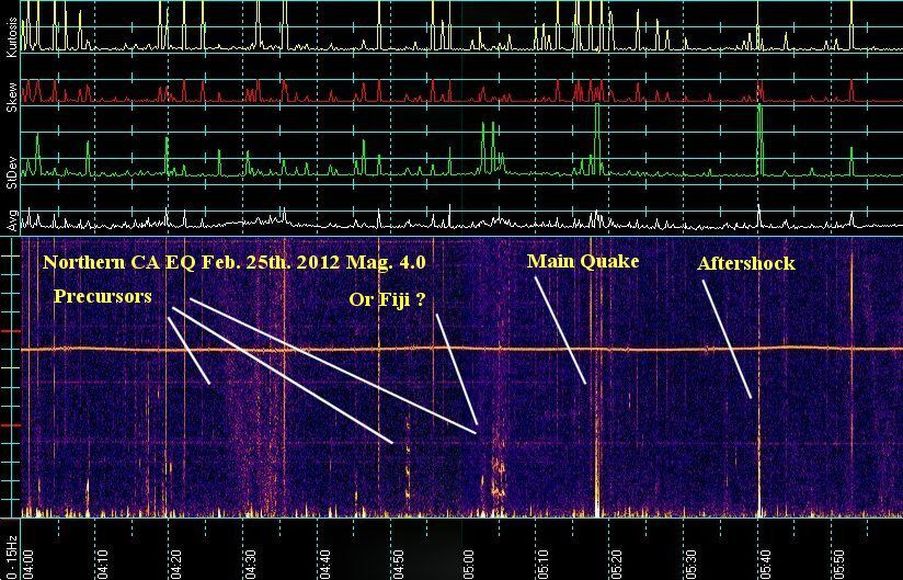
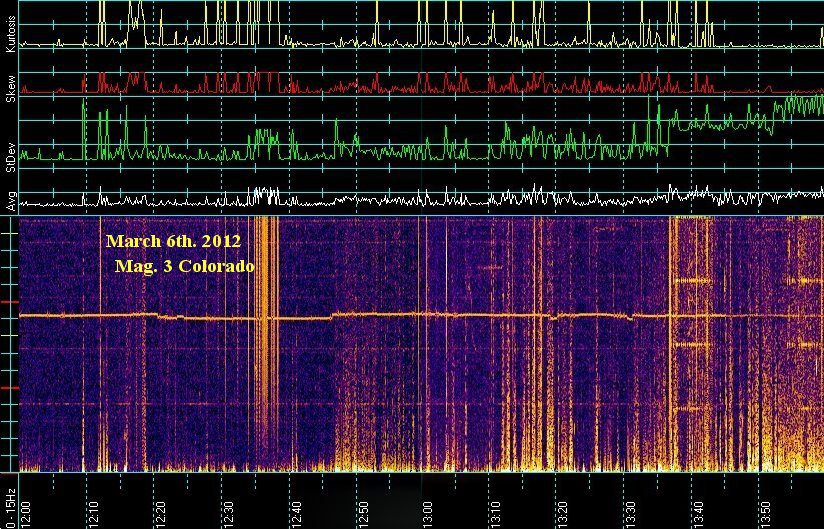
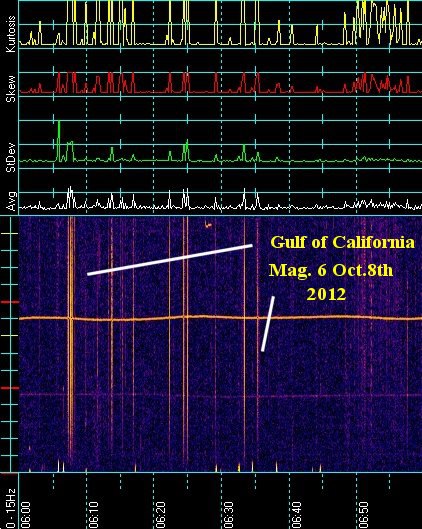
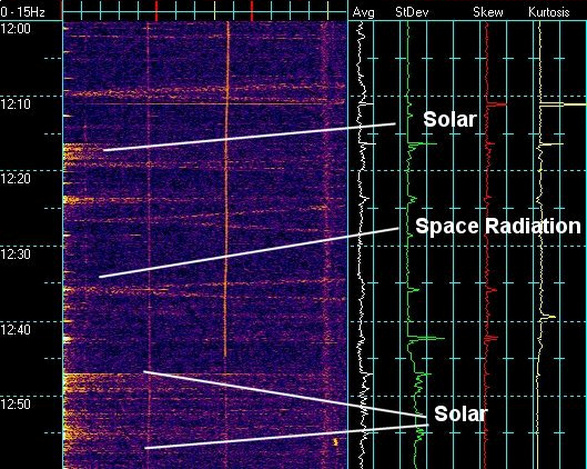
The blue is just the background. Like the old TV screens where you could set contrast, bright and dark. Whenever a signal happens be it from the sun, the earth, or beyond it produces a brightening in the screen. The bottom scale or y-axis as it is called is the time. So we know what time the event happened and how long it lasted. The left side of the chart with all the small horizontal lines is the x-axis. Each little line represents 1Hz. in frequency. So the first little line is 1Hz. the next 2Hz. and on up until 15Hz. My system detects magnetic changes in our planets magnetic field so when a disturbance from the sun contact our magnetic field it registers on the chart as our magnetic field is wobbling. But my system also detects proton and electron particles also as they impact the planet. And finally this system detects earthquakes and their precursors as it sees the energy given off by a fault before it does a physical shift. A friend at NASA discovered when rocks are put under great stress and pressure they emit Pholes. Positively charge particles just before and when they finally break due to the stress and pressure. The positively charged Pholes leave a signature with my equipment. So the trick is to learn what is the sun's signature and what is earth related. Of course there are other particles coming at us from space so there is lots to look at. : )
6.9 Mganatute
Magnetude 6.0 Gulf of California EQ as seen from the weak side of my sensor.
Not positive but perhaps I have been seeing California precursors tonight and not solar stuff since
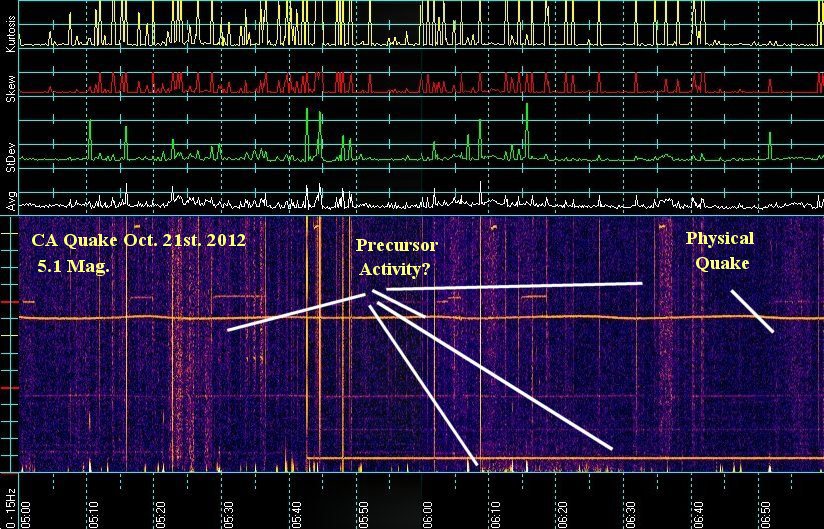
CA just had a 5.1 Mag. Quake. And Kurtosis has been wild and active all night.
CA just had a 5.1 Mag. Quake. And Kurtosis has been wild and active all night.
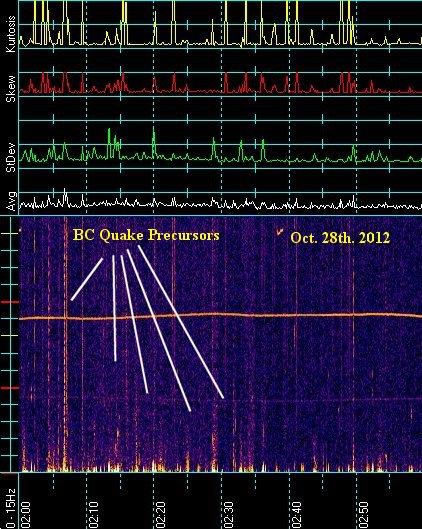
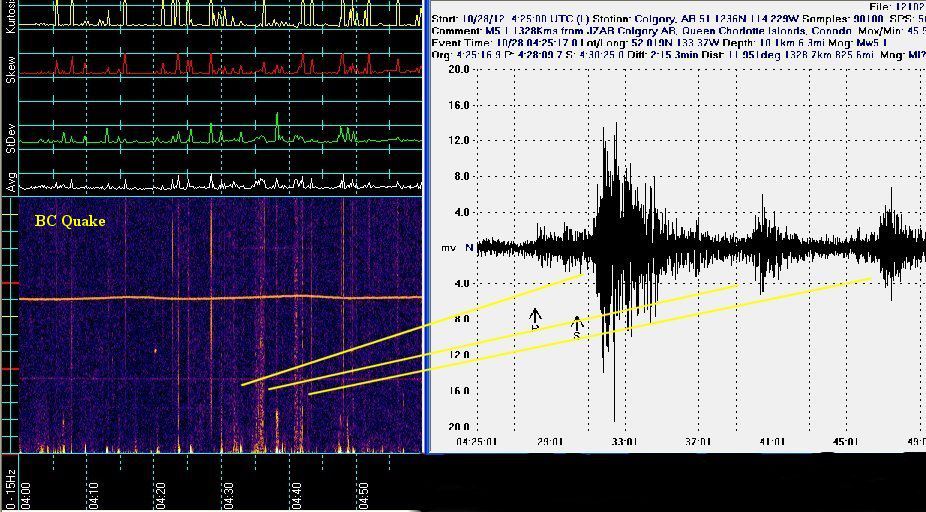
Vancouver 7.7, Oct. 28, 2012
Dec 2012 Boom
No stretch zone. Compression zone from here to coast
Lieder is a BAAAAAAAAAAAD source
This quake could be related to this though time is separated by a few days:
2.7 81km NNW of Kayenta, Arizona 37.4173 -110.584 16.8 11/30/2012 15:48 uu60006472 http://earthquake. usgs.gov/ earthquakes/ eventpage/ uu60006472
any quake in N. Az is pretty unusual. Kayenta is on very stable flat horizontal ground
(there are some micro quakes to the west and north which occur related to Grand Canyon)
Verde Valley and Sedona zone is the basement zone for the Three Sisters volcano peaks (which is the center of a pretty large volcanic field which was last active only about 1000 years ago and spewed out many cinder cones to the east of Flagstaff).
The continent is deeply riven and faulted in Verde Valley, to the north of it rises the Mogollon Rim of the continental plateau, to the south lies a broken rim edge which takes the form of high mesas which are falling literally to the SW and gradually has been eroded at the southern edge into the Sonoran plain, on which sits the Phoenix Metroplex, and to the west into the Mojave Desert & the Colorado River.
Between the two lies the Verde valley which runs all the way from Sedona (actually through Oak Creek up close to Flagstaff) to the Fountain Hills and Salt Lakes area to the NE of Scottsdale. It carries water year round from Flagstaff zone to Scottsdale zone.
About 20 miles from Camp Verde down the Valley the south is a small hot springs, the only known remnant to the volcanic activity in the area. The Three Sisters are quite a distance from it, some 60 miles I would reckon as the crow flies, maybe more, but the hot springs are at about 3000 feet elevation while the Three Sisters tower above 7000 feet over Flagstaff.
In all probability both the quake and the boomboom are tectonically related by the cracking and fault movements of the interior continental zones forced by the compression movements of the entire plate from the Atlantic to the Pacific. N.A. has been much more tectonically active this year than it has been for perhaps nearly 18 years, it is at a near record high, composed of multitudes of small quakes.
The boomboom heard over a wide area is specifically a classical signal of steam explosions in the faults through which the magma and heat rises prior to volcanic eruptions. People near active volcanos are quite familiar with these noises. The desert rats out here in Arizona are not.
If the noises continue, typically sporadically, they probably will be signaling the rise of magma intrusions through the faults. Yep, that means volcanic eruption might eventually result. These boombooms generally produce seismic signals which are under Class 2. These are difficult to detect and record with certainty from remote stations.. Keep in mind that volcanic zones can signal for decades before getting serious.
Also keep in mind that the Three Sisters field blew an enormous amount of cinders and ash into N and E Arizona, New Mexico zone some 1000 years ago. There were several active vents.. Arizona is not likely to have a mega-quake in the normal run of things, but it sure could have a mega-eruption.
If more boomboom is heard during the next couple of months, you will probably discover that USGS is setting up a monitoring shop out here, probably through NAU in Flag. --MMW
At 10:28 PM 12/5/2012 -0700:
> http://www.examiner .com/article/ mysterious- pre-cataclysm- booms-are- back-verde- valley-arizona Just before 5 p.m. on Tuesday, Dec 4, 2012, a loud boom was followed by a second blast that shook windows from Cornville to Jerome and Camp Verde, Arizona, rocking Verde Valley for a distance of plus or minus 22 miles. It was just boom-boom-boom- boom-boom all over the Verde Valley.These so-called mysterious booms are related to plate stress and adjustments and represent a wakeup call for the world.
CBS 5 News first received reports of the explosion-like noises shortly after 5 p.m. and began checking with law enforcement and government sources. The U.S. Geological Survey (USGS) reported no significant earthquake activity in Arizona that could have created the booms. No surprise there.The Yavapai County Sheriff's Office had deputies in the area who either heard it or tried to respond to resident calls about it. They found nothing.Per Nancy Lieder and ZetaTalk, the sounds are caused by the earth heaving, dropping, and clapping. Lieder writes:Increasingly as the pole shift nears, the Earth will give evidence of the compression and tension in her surface by what humans will perceive to be sonic booms. The mechanism is in fact the same, clapping air masses, the same mechanism that produces thunder. http://www.zetatalk .com/science/ s70.htm
According to Lieder (who by the way started writing about this stuff in the 1990s), for every compression adjustment of the earth in one place, in some other place an earth rift widens. A widening rift does not jolt the bordering plates as earthquakes do; the adjustment is silent. These so-called mysterious booms can be caused by one of several phenomena:Adjustmen ts that ripple through the land causing a boom when dropping or heaving ground makes the air above it clap as it rushes in to fill a void.Stretch zones booms as land sinks because the rock supporting it pulls apart creating a void - boom . . the air above it claps. This can happen over water as well as land. Snapping rock booms as earth heaves causing poorly supported rock strata to snap . . and boom.
Meanwhile back in Cottonwood, Jean Swesey, who was doing homework with her son when she heard the booms says, "It was a whole series of booms, up to six or seven. It was fast, it went loud. We were quiet and then my daughter down the hall screams really loud, ‘Did you hear that?’ I sat there for a second and I heard another set.""It sounded like thunder, but underground, " Swesey said. "Like muffled thunder. And all the dogs in the neighborhood, all of them that were outside all started barking at once."It seems that Swesey wasn't alone. Residents in communities in and around Verde Valley and as far away as Flagstaff called 911 or the police or fire department to report the strange booming sounds. The Camp Verde Marshal also received a number of phone calls about the booms, but officers found no evidence of any explosions. The Sedona Fire District even dispatched a crew to check a report of a “strange odor,” which may or may not be related to the sounds.
Camp Verde resident John Stephens says, "There was a boom and I thought, thunder. But as I was looking around for clouds I heard a second one that sounded like it came from Mingus Mountain. Then I went to see if the spring on my garage door opener had broken.”Kristi Gagnon, fire marshal for the Camp Verde Fire District, said she and fire Chief Clayton Young were in the administrative offices when they heard the noises. Their curiosity eventually drove them outside the building, believing something had hit the roof, but found nothing there.
Having grown up in California, Gagnon thought it was an earthquake. "It had that similar sound but nothing was shaking and the ground wasn't moving. It was interesting for sure," said Gagnon, who did get a report from a resident living near the Camp Verde Library saying the noise actually shook stuff off the shelf.Darby Martin with the Camp Verde Marshal's Office said she received a call from her son who was working for a drilling company, core drilling at the Bagdad copper mine, who reported hearing a similar noise two hours earlier. "He said that around 3 p.m. his crew heard two loud booms. They thought there was an earthquake at the mine," she said.Chief Joe Moore with the Clarkdale Fire District heard it, too, and reported that it sounded just like dynamite.
Whatever it was, it did not appear to be an isolated event. It was just boom-boom-boom- boom-boom all over Verde Valley.Let’s see, is Arizona a stretch zone? Let the truth be told. If the continental United States is being pulled diagonally from the San Diego area to up around the New England states, then it most probably is in a stretch zone.
Keep in mind that the statistical average for Class 6+ quakes is one every two days.....somewhere in the world, most probably in the Ring of Fire. But they tend to group around the Lunar Full and New phases. It is a virtual certainty to have a Class 6+ quake every syzygy or within a day.
It is generally true that you will get two or three within a three day syzygy window.
It is generally true that you will get two or three within a three day syzygy window.
Magnetometer
I am getting a bit bored watching Gama radiation levels and the planet's magnetic field in graph form, so I switched over to another software program we created. It is basically similar to what HAARP uses with their small three foot magnetometer but I run a six footer wound with 7.5 miles of wire. More sensitive then HAARPS. This graph will still detect the planet's magnetic field change but it will capture other stuff. So let's go snooping and I'll post charts as I see the weird stuff. Maybe the Phoenix lights will return. HAARPS system being near the Polar Electrojet will see more things produced by the Electrojet whereas my system will see more of what the source produces They are concerned about the South Atlantic anomaly. The planet's internally produced magnetic field is acting weird which is usually a precusor to major earthquake activity. The Bermuda Triangle is also getting weird magnetically speaking. I do not believe a pole shift is coming as all computers models suggects it is 1200 years away yet. But I feel we will see plenty of shake rattle and roll in our lifetime. Keep in mind the Earth cycles slowly and not in a bang the poles shift.
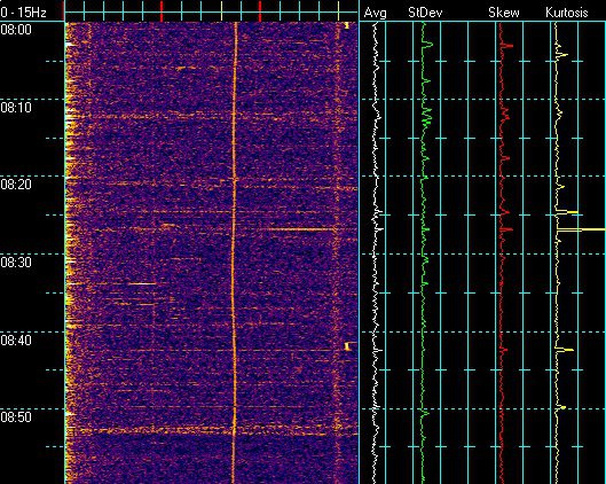
To familiarize you with what we will see this chart is from this morning at sunrise.
Notice how the thin signal from the grid near 9Hz. reduces strength at 6:47 this morning. This is probably due to the smart meter
on my house adjusting to daytime rates.
Notice how the thin signal from the grid near 9Hz. reduces strength at 6:47 this morning. This is probably due to the smart meter
on my house adjusting to daytime rates.
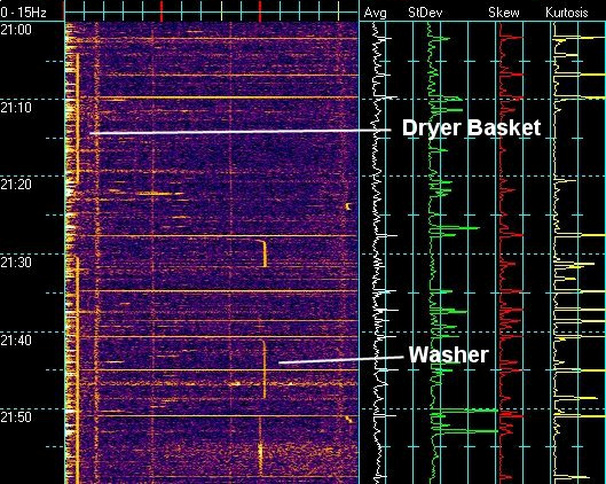
This is to show how the neighbors dryer basket produces a signal at .8Hz. and my washer one at a higher frequency. Just the dryer basket turning disturbs the local magnetic field enough to cause this. All the more need for me to get this equipment OUT of the city so it can see what it was designed to see without manmade interference.
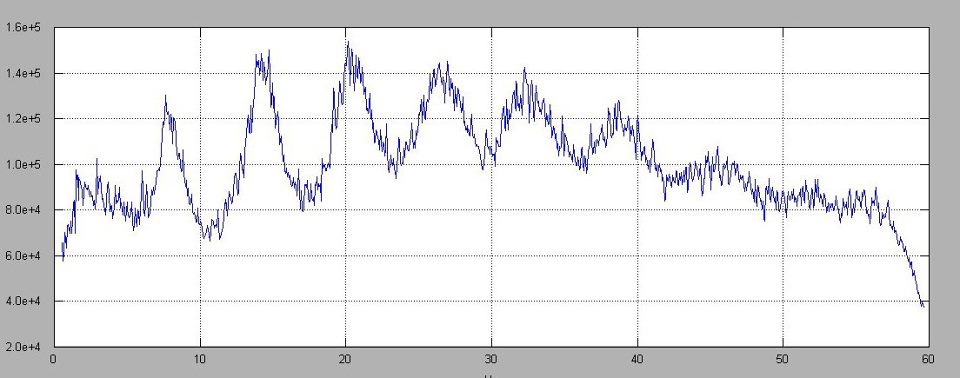
Schumann Resonance
Here is Schumann. Eight modes or simply put eight resonances.
Lonetree monitors Schumann 24/7 as part of a research project for M.I.T.
Lonetree monitors Schumann 24/7 as part of a research project for M.I.T.
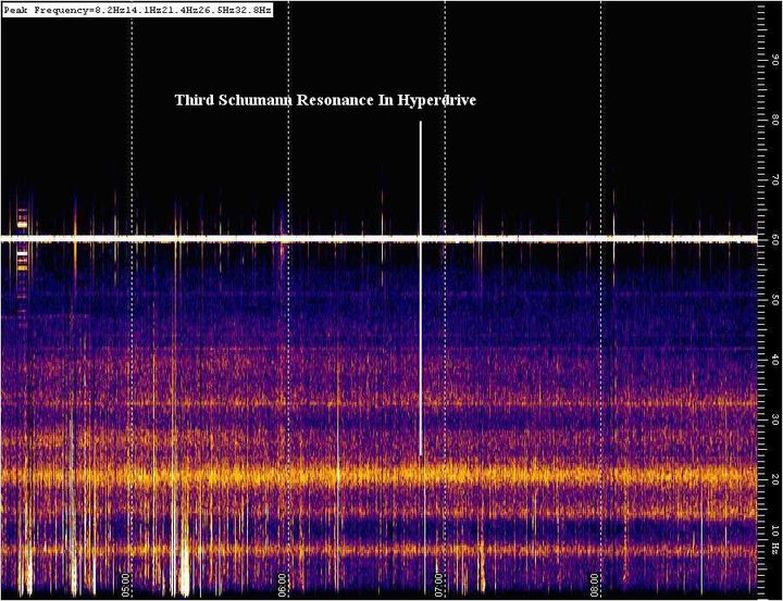
8/27/11 Third Schumann Resonance in Hyperdrive.
NASA's plan to create a space based Earthquake detection system since they know the atmosphere changes above an area before a quake occurs here is another fact for you. The atmosphere can change so much ...it intensifies one, two or three of the Schumann modes. In this chart you can see the third mode brighter then heck. I recorded this 4 days before a significant quake occurred in California several years ago. All we need do is listen to Gaia's voice!
NASA's plan to create a space based Earthquake detection system since they know the atmosphere changes above an area before a quake occurs here is another fact for you. The atmosphere can change so much ...it intensifies one, two or three of the Schumann modes. In this chart you can see the third mode brighter then heck. I recorded this 4 days before a significant quake occurred in California several years ago. All we need do is listen to Gaia's voice!
August 31st. 04:00 UTC 2011
I can not explain this one. For the last three days I have been seeing this brightening in intensity beginning about an hour after sundown. I want to say it is atmospheric as earthquake precursors should not be this intense unless something big was brewing. The fact that it happens after sundown leads me to believe it is charged particles originating from space or something funny our atmosphere is doing. Time will tell. This could also be tectonic plate stress relief so it may produce this signature but it will go away as easy as it appeared. At any rate I'm chasing my tail on this one so I'm going to sleep on it and wait and watch.
I can not explain this one. For the last three days I have been seeing this brightening in intensity beginning about an hour after sundown. I want to say it is atmospheric as earthquake precursors should not be this intense unless something big was brewing. The fact that it happens after sundown leads me to believe it is charged particles originating from space or something funny our atmosphere is doing. Time will tell. This could also be tectonic plate stress relief so it may produce this signature but it will go away as easy as it appeared. At any rate I'm chasing my tail on this one so I'm going to sleep on it and wait and watch.
More from Aug. 31st. 2011. Finally subsides a bit.
SOLAR FLARES
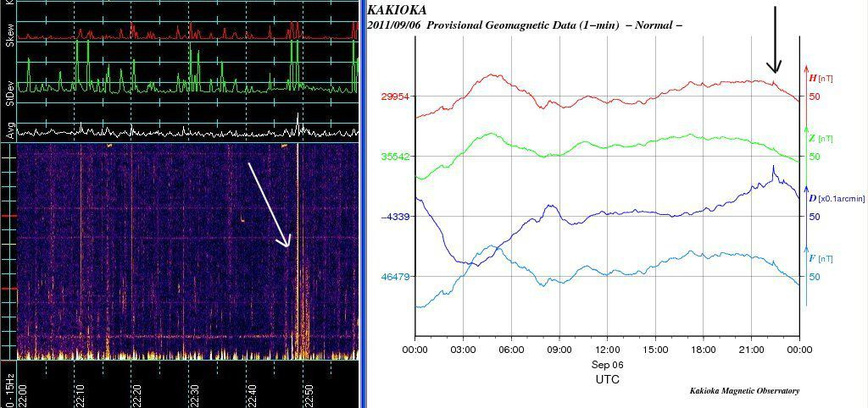
Just to show the sensitivity of my system here is a comparison of today's 9/6/11 M-Class flare as seen on one of Japan's magnetometer stations as compared to what I see. The arrows mark the event.
Solar 9-8-11 All the vertical waves of lines you see are due to increased electrons hitting the atmosphere and magnetic field from the recent solar flare activity. Some may feel a little out of it during this. More flares occured today.
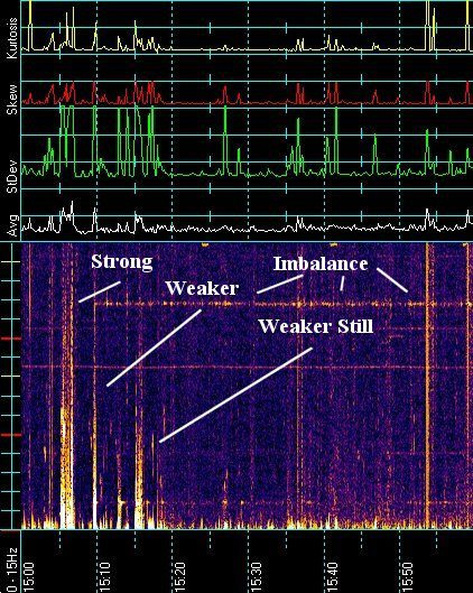
I couldn't sleep thinking about what may have caused the 500 KV line to fail between here and San Diego. I reposted this chart again but look where I wrote the word imbalance. The horizontal broken up line it points to is a harmonic of the three phase power grid that feeds my area. Notice you do not see this line until after the first wave of the flare hits. This tells me the flare impact today caused an imbalance on the three phase portion of the power grid. The 500 Kvolt line that failed to san Diego just might have failed due to the flare. So now it is wait and watch to see what the power company says.
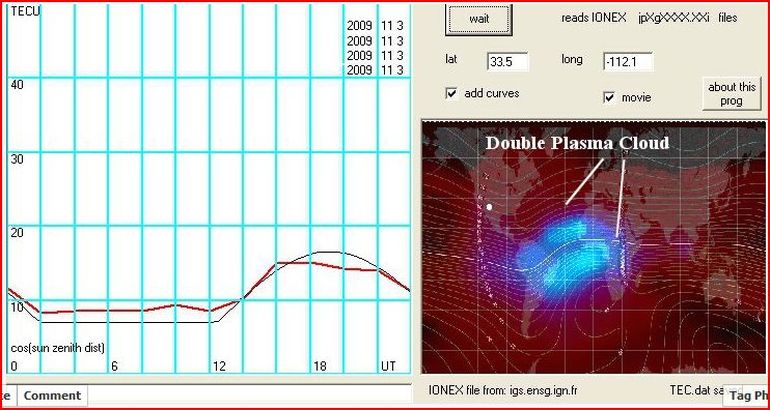
The sun creates what is called the plasma cloud in our upper atmosphere. It is highly charged and of course the cloud follows the sun as it travels across the sky. At sunset last night there where two distinct disturbances rather then the usual one. I think it is due to the plasma cloud becoming two clouds instead of one. No big deal and no cause for alarm. I feel the plasma cloud effects weather so I look for patterns that may effect the weather.
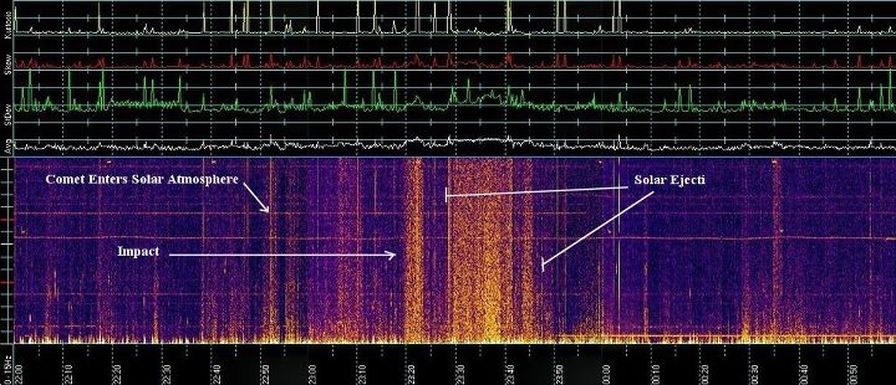
Comet Solar Impact Oct. 1st. 2011. The ejecti or what was left of the comet left quite a signature with my equipment as can be seen.
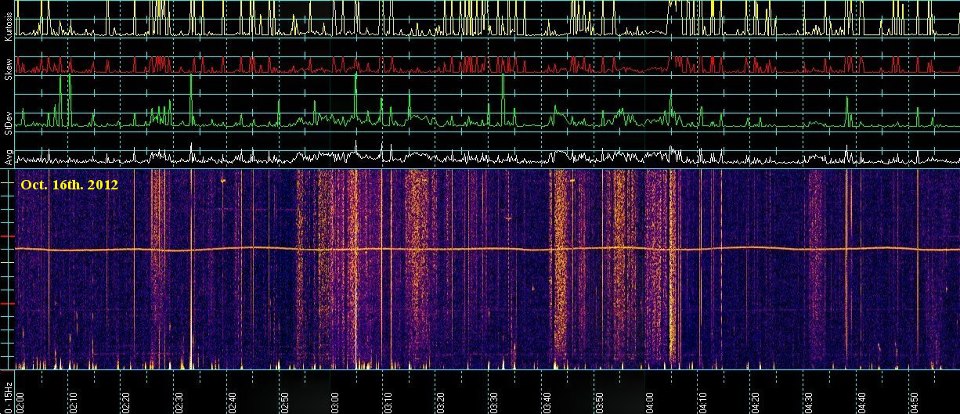
Solar storm hits Earth, Oct 16, 2012
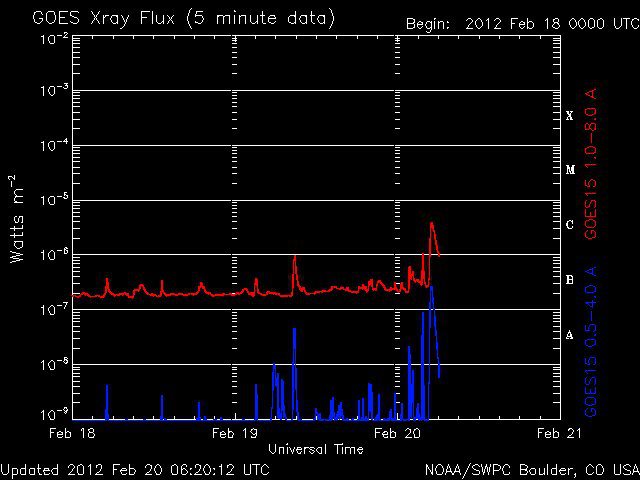
X-ray activity is up from the sun. Look for more earthquake activity in the not too distant future. Proton increase will also effect this.
http://www.n3kl.org/sun/noaa.html
http://www.n3kl.org/sun/noaa.html
See how there is the large spike followed by a brief quiet spell and then a lesser jolt? Bow Shock?
http://www.youtube.com/watch?v=BDZj1CmsJ64
http://www.youtube.com/watch?v=BDZj1CmsJ64
(c)2011-2017, Benjamin Lonetree & Iona Miller
All Rights Reserved
All Rights Reserved
